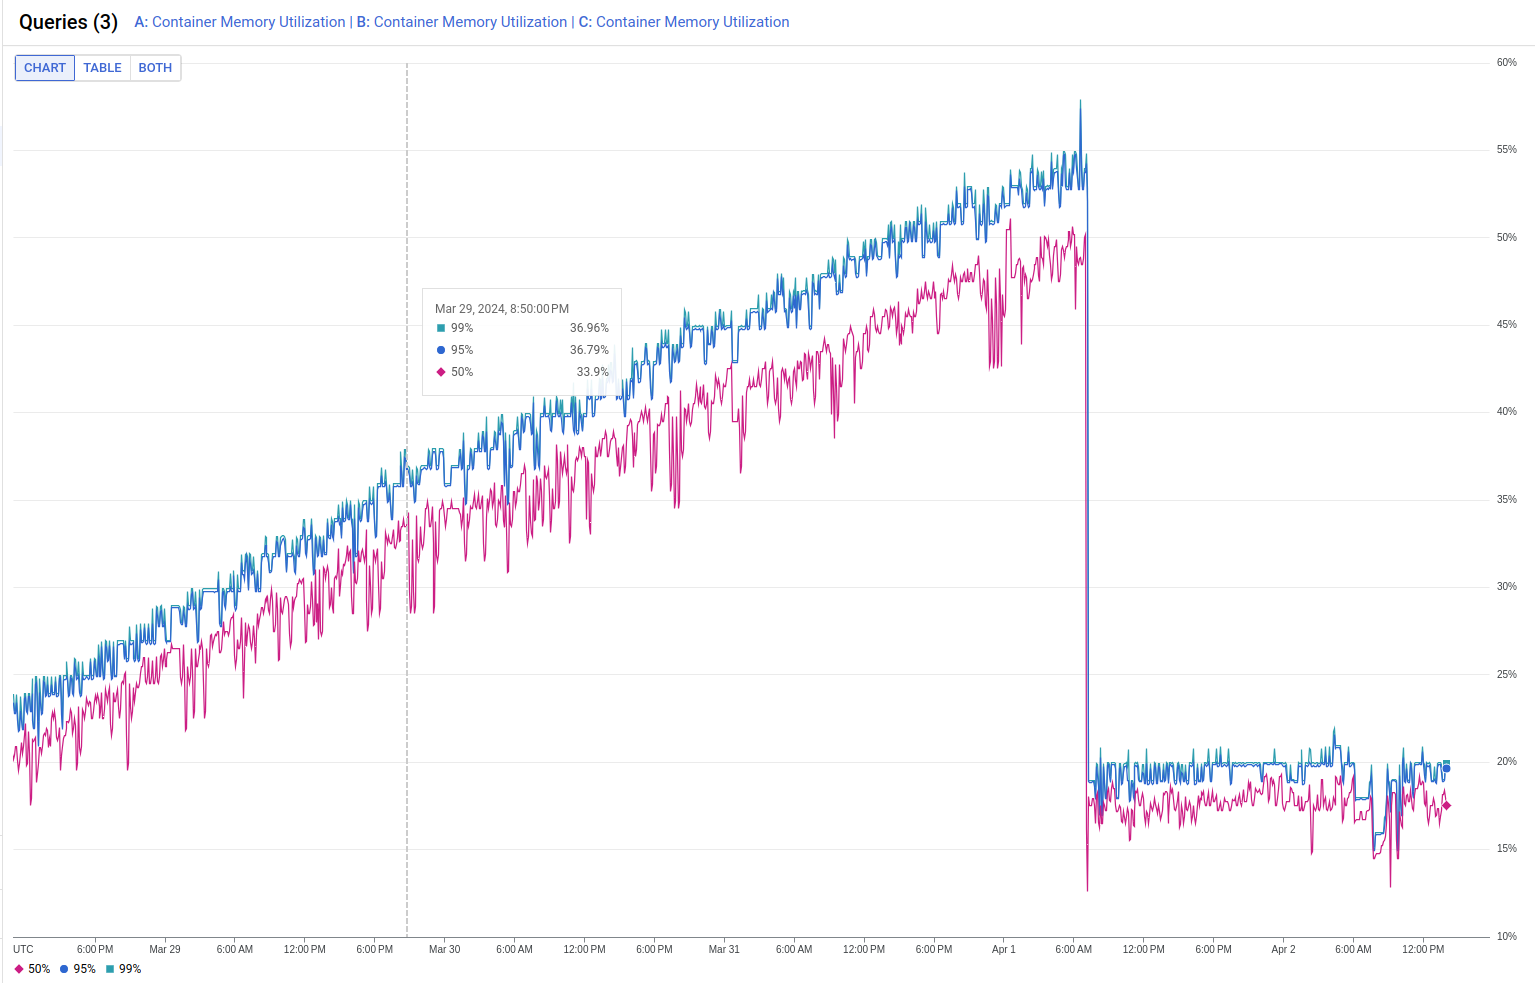
Unlike other languages, a Node server keep running forever. If it happens to have memory leak in your app, it will get worse until it blows up. This is how my server memory looks like after releasing new feature for a week. The memory keep going up and up.

It wasn’t obvious immediately because requests come in, the server needs to do its job, and need to allocate memory. We need to give it some time to see if the memory consumption become stable or it keep 🚀
Once it becomes more obvious you should grab your tools and find out the leak as soon as possible. Before your server blow up.
When it comes to NodeJS, Chrome Dev tool is one of the bests. A few simple steps can help you identify the leak.
- Run your app with
--inspector--inspect-brkflag - Open devtool and attach it to running node process
- Make a request and take an snapshot
- Make an other request and take an other snapshot
- Compare it with previous one, find out what changed by delta
- If it is not obvious, you can try running a bunch of requests before taking an other snapshot, because memory leak adds up proportional with number of requests
- At this point you should found the naughty little bug, go fix it. It really depends on specific context.
- Depends on your project process, you can test it local, deploy to staging, or deploy a hotfix. But make sure you keep an eye on it